Valdez
Above 4,000ftModerate
2,000 to 4,000ftModerate
Below 2,000ftLow
Degrees of Avalanche Danger
Avalanche Problems
Problem 1
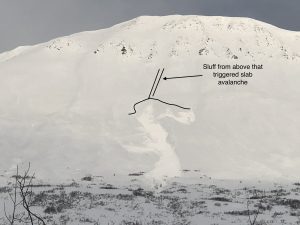
Buried surface hoar exists 1.5-3 feet deep in the intermountain and continental zones on all aspects above 2500′. A significant natural avalanche cycle occurred at this interface during the 1/23-25 storm (see avalanche activity section) . This layer has been found to be reactive in stability test as recently as 1/28, although results are becoming more stubborn and the faceted grain in question is rounding and becoming mixed with rounds (stronger snow). The depth of this weak layer is variable depending upon the area you choose to travel. Where it is closer to the surface (16-20 inches) human triggered avalanches are more likely. Where buried surface hoar is 3 feet deep or more the likelihood is less, although if triggered, wide propagations could be expected.
Signs of instability may not exist even when dangerous conditions are present. Digging snowpits is the most effective way to identify where this layer is present and its sensitivity. Although, this can be a difficult assessment tool due to spatial variability (conditions that vary from place to place) and results that may be confusing or misleading. This layer is becoming more subtle and could easily be missed.
Likelihood:
- Almost Certain
- Very Likely
- Likely
- Possible
- Unlikely
Size:
- Historic
- Very Large
- Large
- Small
Trend
- Increasing
- Steady
- Decreasing
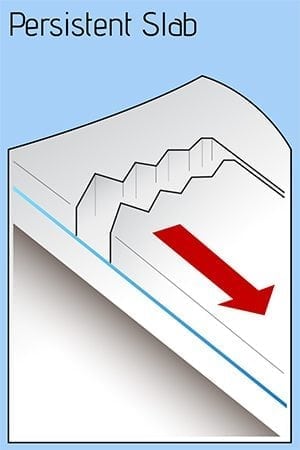
Problem 2
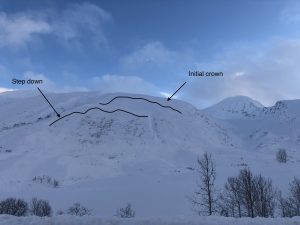
Weak snow exists near the base of our snowpack in all three climate zones. Recent heavy snowfall and rising temperatures has increased the stress upon this weak snow. The likelihood of deep human triggered avalanches has gone from unlikely to possible. This layer will be difficult to directly affect by a person or machine but a persistent slab avalanche (see problem 1) may be able to step down to deep layers in our snowpack. DOT avalanche mitigation efforts did just this on the buttress to the east of nicks(see avalanche activity section), showing that it is still possible for deep layers to produce avalanches. The most likely areas to affect deep instabilities would be in steep rocky areas where the snowpack is thin in the continental zone.

Likelihood:
- Almost Certain
- Very Likely
- Likely
- Possible
- Unlikely
Size:
- Historic
- Very Large
- Large
- Small
Trend
- Increasing
- Steady
- Decreasing
Avalanche Activity
Below is a summary of observed Avalanche activity from the last 7 days. Avalanches that were noted earlier in the season can be viewed by clicking the link below.
If you trigger or observe a natural avalanche consider leaving a public observation.
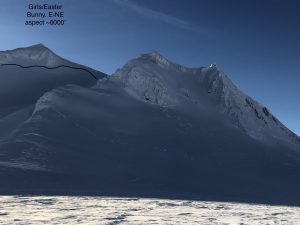
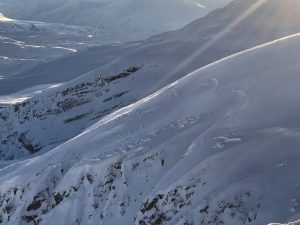
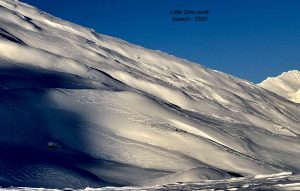
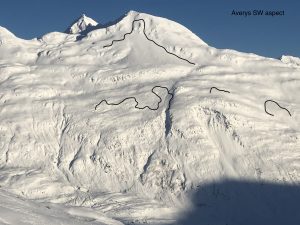
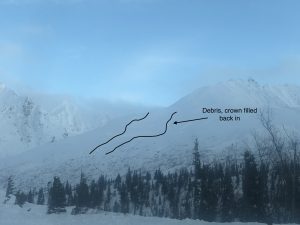
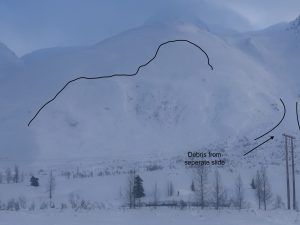
1/26- A significant amount of avalanche activity occurred during the 1/23-25 storm. Avalanches were concentrated in the Intermountain and Continental zone and occurred on all aspects above 2000′. Most of the activity appears to have failed mid storm at the 1/14 buried surface hoar layer (see problem 1) with crowns filled back in. Notable avalanches occurred on: Crudbusters, Iguana Backs, Nicks Buttress (artillery triggered), Gully 2 buttress, Little Girls, Easter Bunny, Averys, RFS.
Crudbusters north aspect ~4500′ SS-N-R2-D2.5
Hippie Ridge south aspect ~4000′ -SS-Ny-R1-D2
Giovanni (Buttress east of Nicks Happy Valley)north aspect ~3600′ SS-AA-R3-D3. DOT avalanche control work triggered a large soft slab avalanche that stepped down to weak snow near the ground half way through the path.
Buttress between Nick and Gully 2. north-northwest aspect ~3500′ SS-N-R4-D2.5
Weather
Check out our updated weather tab! A collection of local weather stations are available for viewing with graphs and tabular data included.
NWS Watches and warnings
NONE
NWS Point forecast for Thompson Pass
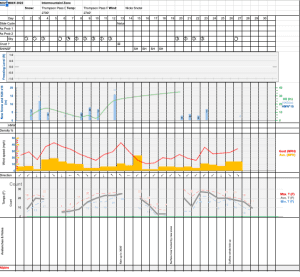
Date               Sunday 01/29/23         Monday 01/30/23
Time (LT)          06    12    18    00    06    12    18    00    06
Cloud Cover        OV    OV    OV    OV    OV    OV    OV    OV    OV
Cloud Cover (%)    85    90   100   100    85    75    70    80    75
Temperature        28    30    31    29    29    29    28    26    25
Max/Min Temp                   31          28          30          25
Wind Dir           SW    SW     S     S     S     S     N    NE    NE
Wind (mph)          4     6     5     4     4     2     3     6     5
Wind Gust (mph)                                                    18
Precip Prob (%)    10    50    80    80    60    40    40    40    50
Precip Type               S     S     S     S     S     S     S     S
12 Hour QPF                  0.06        0.09        0.04        0.04
12 Hour Snow                  0.3         0.8         0.1         0.0
Snow Level (kft)  1.1   1.3   1.3   1.3   1.2   1.0   0.9   0.9   0.6
Click on link below for Thompson Pass weather history graph:
| Date:
01/29 |
24 hr snow | HN24W* | High temp | Low temp | 72 hour SWE* | January snowfall | Seasonal snowfall | Snowpack Depth |
| Valdez | 0 | 0 | 35 | 26 | .07 | 46 | 143 | 40 |
| Thompson pass | 0 | 0 | 30 | 16 | N/O | 92 | 286 | 48 |
| 46 mile | 0 | 0 | 23 | 13 | 0 | 32 | ~66** | 38 |
*HN24W- 24 hour Snow water equivalent in inches
*SWE– Snow water equivalent
**46 mile seasonal snowfall total begins December 1st.
Additional Information
Click on the link below for a running summary of the seasons weather history.
Announcements
The avalanche hazard is moderate above 2000 feet. It will be possible to trigger an avalanche 2-3 feet deep that fails on weak snow buried by the most recent storm. Steep convex slopes, unsupported terrain and thin areas of the snowpack will be the most likely places to trigger an avalanche. Below 2000′ the hazard is low where a rain saturated snowpack has refrozen and gained strength.
Posted by Gareth Brown 01/29 8:00 am.
For a description of current avalanche problems, weather information, season history and more click the (+ full forecast) button. Avalanche forecasts will be issued Wednesday-Sunday.
If you have pictures of recent natural or human triggered avalanches or notice signs of instability such as shooting cracks or collapsing, leave an observation to help improve forecast accuracy.