Valdez
Above 4,000ftModerate
2,000 to 4,000ftModerate
Below 2,000ftLow
Degrees of Avalanche Danger
Avalanche Problems
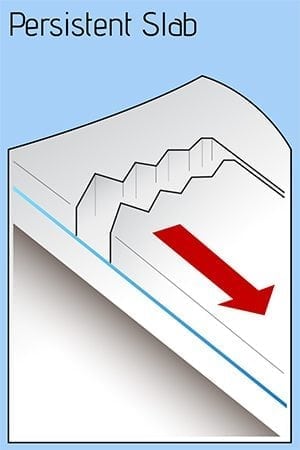
Problem 1
Buried surface hoar exists around 2 feet deep in the intermountain and continental zones. Stability tests have not produced propagation at this layer the last 2 days although multiple large natural and artillery triggered avalanches have occurred during the most recent storm. It initially appears that this layer is no longer intact widespread, but may remain reactive in specific areas. This makes for a dangerous setup where assessment is not simple. Signs of instability may not exist even when dangerous conditions are present. Digging snowpits is the most effective way to identify where this layer is present and its sensitivity. Although, this can be a difficult assessment tool due to spatial variability (conditions that vary from place to place) and results that may be confusing or misleading.
Currently our goals in the mountains should directly correlate to our experience with snowpack assessment. The weak layer we are dealing with is notorious for remaining for long periods of time.
It is possible that the warm temps and weight of the most recent storm has compressed this layer, allowing it to round (heal) and be absorbed into the snow beneath. This outcome is unclear at this point and we are maintaining the stance that a potentially dangerous weak layer exists, until we can gather more information.
Likelihood:
- Almost Certain
- Very Likely
- Likely
- Possible
- Unlikely
Size:
- Historic
- Very Large
- Large
- Small
Trend
- Increasing
- Steady
- Decreasing
Problem 2
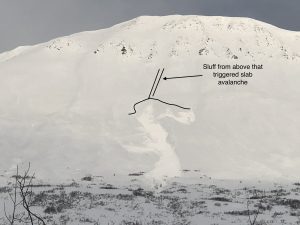
Weak snow exists near the base of our snowpack in all three climate zones. The weather we have experienced the last 3 days has increased the stress upon this weak snow. The likelihood of deep human triggered avalanches has gone from unlikely to possible. This layer will be difficult to directly affect by a person or machine but a persistent slab avalanche (see problem 1) may be able to step down to deep layers in our snowpack. DOT avalanche mitigation efforts did just this on the buttress to the east of nicks, showing that it is still possible for deep layers to produce avalanches.

Likelihood:
- Almost Certain
- Very Likely
- Likely
- Possible
- Unlikely
Size:
- Historic
- Very Large
- Large
- Small
Trend
- Increasing
- Steady
- Decreasing
Avalanche Activity
Below is a summary of observed Avalanche activity from the last 7 days. Avalanches that were noted earlier in the season can be viewed by clicking the link below.
If you trigger or observe a natural avalanche consider leaving a public observation.
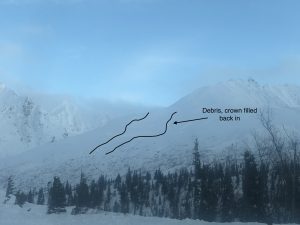
1/26- Skies cleared enough to get a look at some of the natural and artillery triggered activity that occurred on during the 1/23-1/25 storm. Most of the activity appears to have failed mid storm with crowns filled back in. Notable avalanches occurred on:
Crudbusters north aspect ~4500′ SS-N-R2-D2.5
Hippie Ridge south aspect ~4000′ -SS-Ny-R1-D2
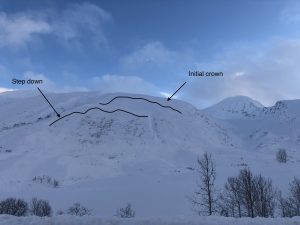
Giovanni (Buttress east of Nicks Happy Valley)north aspect ~3600′ SS-AA-R3-D3. DOT avalanche control work triggered a large soft slab avalanche that stepped down to weak snow near the ground half way through the path.
Buttress between Nick and Gully 2. north-northwest aspect ~3500′ SS-N-R4-D2.5
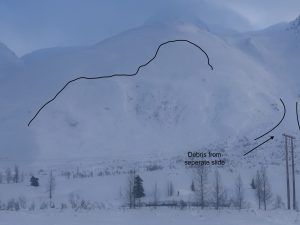
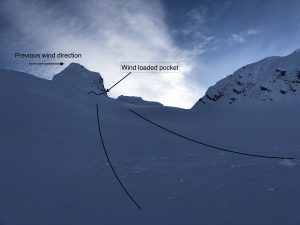
1/21- Several D2 natural avalanches were observed on wind loaded slopes that failed at the 1/14 BSH interface. These probably occurred on 1/19. Avalanches were observed on Hippie Ridge South aspect, RFS Northwest aspect, Cracked Ice Northwest aspect and Python (Cherry couloir) East aspect. These all appeared to be 1-2 feet deep.
Weather
Check out our updated weather tab! A collection of local weather stations are available for viewing with graphs and tabular data included.
NWS Watches and warnings
NONE
NWS Point forecast for Thompson Pass
Date               Friday 01/27/23         Saturday 01/28/23
Time (LT)          06    12    18    00    06    12    18    00    06
Cloud Cover        SC    FW    BK    SC    BK    SC    SC    SC    BK
Cloud Cover (%)    35    15    55    30    70    35    25    30    55
Temperature        24    24    25    28    29    31    27    19    20
Max/Min Temp                   26          25          33          18
Wind Dir            N    NE    NE    NE    SW    SW     W    SW    SW
Wind (mph)          5     9    10     4     3     3     2     3     5
Wind Gust (mph)          23    25    16
Precip Prob (%)     0     0     0     0     0     0     5     5    10
Precip Type
12 Hour QPF                  0.00        0.00        0.00        0.00
12 Hour Snow                  0.0         0.0         0.0         0.0
Snow Level (kft)  0.2   0.3   0.6   1.1   1.7   1.2   1.5   1.5   1.2
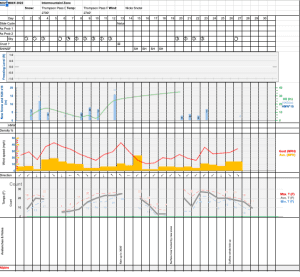
Click on link below for Thompson Pass weather history graph:
| Date:
01/27 |
24 hr snow | HN24W* | High temp | Low temp | 72 hour SWE* | January snowfall | Seasonal snowfall | Snowpack Depth |
| Valdez | 0 | .07 | 36 | 30 | 1.42 | 39 | 136 | 47 |
| Thompson pass | 0 | 0 | 30 | 21 | N/O | 92 | 286 | 49 |
| 46 mile | 0 | 0 | 41 | 21 | N/O | 32 | ~66** | 40 |
*HN24W- 24 hour Snow water equivalent in inches
*SWE– Snow water equivalent
**46 mile seasonal snowfall total begins December 1st.
Additional Information
Click on the link below for a running summary of the seasons weather history.
Announcements
The avalanche hazard is moderate above 2000′ and low below where a rain saturated snowpack has refrozen. Human triggered avalanches are possible 2-3 feet deep that are big enough to injure, bury or kill a person. Weak snow exists underneath the most recent snowfall that may remain reactive to human triggers. Signs of instability may not be present even when unstable conditions could exist.
Posted by Gareth Brown 01/27 8:00 am.
For a description of current avalanche problems, weather information, season history and more click the (+ full forecast) button. Avalanche forecasts will be issued Wednesday-Sunday.
If you have pictures of recent natural or human triggered avalanches or notice signs of instability such as shooting cracks or collapsing, leave an observation to help improve forecast accuracy.